Indicators are tools you add to your chart to measure trend, momentum and volatility — turning raw price into clearer signals. There are hundreds, but a few do most of the work. Here are the essential forex indicators, what they show, and how to use them without cluttering your chart.
What is a trading indicator?
An indicator is a calculation based on price (and sometimes volume) that is plotted on or below your chart. It helps you spot things the eye might miss — like whether momentum is fading or a trend is strengthening. The SCapitalFX app includes 8 built-in indicators.
1. Moving Averages (MA)
A moving average smooths price into a single flowing line, making the trend obvious. Common settings are the 50 and 200 period. Traders watch for price crossing the MA, or two MAs crossing (a “golden cross” up, “death cross” down), as trend signals.
2. RSI (Relative Strength Index)
RSI measures momentum on a 0–100 scale. Above 70 is often called “overbought” (a pullback may be due); below 30 is “oversold” (a bounce may be due). RSI is great for spotting when a move is stretched.
3. MACD (Moving Average Convergence Divergence)
MACD shows momentum and trend changes through two lines and a histogram. When the MACD line crosses above its signal line, momentum is turning up; a cross below suggests it is turning down.
4. Bollinger Bands
Bollinger Bands wrap price in an upper and lower band that widen and narrow with volatility. Price tagging the outer bands can signal stretched conditions, while a “squeeze” (narrow bands) often comes before a big move.
How to use indicators well
Do not overload your chart. Two or three complementary indicators beat ten conflicting ones.
Combine types — for example a trend tool (MA) with a momentum tool (RSI).
Confirm with price. Indicators support your reading of price action; they do not replace it.
Indicators lag. They are based on past prices, so use them as guides, not crystal balls.
Risk warning: Indicators can produce false signals. No tool guarantees profit and you could lose your invested capital. Always use a stop-loss.
Frequently asked questions
What is the best indicator for beginners?
A moving average is the simplest place to start — it makes the trend clear at a glance. Add RSI once you are comfortable.
How many indicators should I use?
Two or three at most. Combining one trend indicator and one momentum indicator is a common, clean setup.
Do indicators predict the future?
No. They are calculated from past prices and lag the market, so treat them as probability guides, not guarantees.
Which indicators are on the SCapitalFX app?
The app includes 8 built-in indicators covering trend, momentum and volatility, across multiple timeframes.
There is no single “best” way to trade forex — there is the best way for you. Your strategy should fit your schedule, personality and risk tolerance. This guide breaks down the four main trading styles so you can find your fit.
The four main trading styles
1. Scalping
Scalpers make many small trades that last seconds to minutes, aiming for tiny profits each time. It is fast and intense, and because costs add up over many trades, scalpers need the tightest spreads — which is why most use a Raw account.
2. Day trading
Day traders open and close trades within the same day, never holding overnight (so they avoid swap fees). It suits people who can watch the market for a few hours during active sessions.
3. Swing trading
Swing traders hold positions for several days to weeks to catch bigger market “swings.” It needs less screen time — a good fit if you have a job and can only check charts a few times a day.
4. Position trading
Position traders hold for weeks or months, focusing on the long-term trend and fundamentals. It is the most patient style and the least affected by daily noise.
Compare the styles
Style
Hold time
Trades
Screen time
Scalping
Seconds–minutes
Many per day
Very high
Day trading
Minutes–hours
A few per day
High
Swing trading
Days–weeks
A few per week
Low
Position trading
Weeks–months
A few per month
Very low
Which style suits you?
Lots of free time + enjoy fast action? Scalping or day trading.
Busy with a job? Swing or position trading.
Patient and big-picture? Position trading.
Whatever you choose, the rules are the same: have a plan, use a stop-loss, and follow solid risk management. Trade your best sessions too — see best time to trade.
Risk warning: All trading styles carry a high level of risk. No strategy guarantees profit and you could lose your invested capital.
Frequently asked questions
What is the best strategy for beginners?
Swing trading or day trading are often easier to start with than scalping, which is fast and demanding. Begin on a demo to find your fit.
Which style is the most profitable?
None is inherently more profitable — success depends on discipline and risk management, not the style itself.
Do scalpers need a special account?
Scalpers benefit from a Raw account because tight spreads reduce the cost of trading frequently.
Can I change my trading style?
Yes. Many traders try several styles on demo before settling on the one that fits their life and personality.
Find your style
Open a free demo and test different styles risk-free before committing real money.
Most traders spend all their time on strategy — yet the biggest reason they lose is not their system, it is their mind. Fear, greed and impatience quietly sabotage good plans. This guide covers forex trading psychology: the emotions that hurt you, the mistakes they cause, and how to build the discipline that separates winners from the rest.
Why psychology is the hardest part of trading
On a demo account, trading feels easy. Add real money and suddenly your hands shake, you close winners too early and let losers run. The strategy did not change — your emotions did. Mastering them is what makes a trader consistent.
The four emotional enemies
Fear: closing winning trades too soon, or being too scared to enter a good setup.
Greed: oversizing, over-leveraging, or refusing to take profit.
Hope: holding a losing trade and “hoping” it comes back instead of cutting it.
Revenge: trying to win back a loss immediately with a bigger, reckless trade.
Common psychological mistakes
Overtrading — taking trades out of boredom or to “make something happen.”
Moving your stop-loss further away to avoid taking a loss.
FOMO — chasing a move that already happened.
Revenge trading after a loss, usually with too much size.
Abandoning your plan after a couple of losing trades.
How to build trading discipline
Trade a written plan. Rules remove in-the-moment emotion.
Accept losses as a cost of business. Every trader loses; small losses are normal and fine.
Focus on the process, not each outcome. A good trade can lose and a bad trade can win — judge yourself on following your rules.
Keep a journal. Note your emotions on each trade to spot your patterns.
Risk small. When risk is tiny (1–2%), fear and greed shrink too. See risk management.
Take breaks. Step away after a big win or loss before your next decision.
Demo first, then small
Practise your plan on a demo until it is automatic, then go live with the smallest size so the emotional jump is gentle. You can grow size as your discipline proves itself.
Risk warning: Trading carries a high level of risk. Emotional discipline reduces mistakes but does not guarantee profit. You could lose some or all of your invested capital.
Frequently asked questions
Why do I trade well on demo but badly with real money?
Real money triggers fear and greed that demo does not. Bridge the gap by going live with very small size at first.
How do I stop revenge trading?
Set a daily loss limit, and when you hit it, stop for the day. Walking away breaks the emotional spiral.
How do I control fear and greed?
Risk so little per trade that the outcome barely matters, and follow a written plan so decisions are made in advance.
Is trading psychology really that important?
Yes — most traders fail on discipline, not analysis. Managing your mind is as important as any strategy.
Here is the truth most new traders learn too late: you do not need to win every trade to be profitable — you need to control your losses. More accounts are blown by poor risk management than by bad market analysis. This guide gives you seven practical rules to protect your capital and trade for the long run.
Why risk management is everything
Even a great strategy will lose sometimes. Risk management makes sure your losing trades stay small and your account survives long enough for the winners to add up. Protecting capital is rule number one — you cannot trade if your account is gone.
The 7 core rules of risk management
1. Risk only 1–2% per trade
Never risk more than a small slice of your balance on a single trade. On a $1,000 account, 1% is just $10. That way a losing streak cannot wipe you out.
2. Always use a stop-loss
Decide your exit before you enter, and let the stop-loss order close the trade automatically if you are wrong. No exceptions.
3. Aim for a positive risk-to-reward ratio
Target at least 1:2 — risking 20 pips to make 40. With 1:2, you can be right less than half the time and still come out ahead.
4. Size your positions correctly
Work out your lot size from your risk and stop distance — not from how confident you feel. Start with micro lots (0.01).
5. Do not over-leverage
Access to 1:200 leverage does not mean you should max it out. High effective leverage is the fastest way to lose an account.
6. Limit your total exposure
Avoid stacking many correlated trades (for example, several USD pairs in the same direction) — they can all lose together. Cap how much of your account is at risk at once.
7. Have a plan and keep a journal
Write down your entry, stop, target and reason for every trade, then review them. A journal turns mistakes into lessons.
The math that proves it matters
Losses hurt more than equal gains: lose 50% of your account and you need a 100% gain just to break even. That is why keeping each loss small is so powerful — small losses are easy to recover from.
Risk warning: Trading forex and CFDs on margin carries a high level of risk. Risk management reduces — but does not remove — the chance of loss. You could lose some or all of your invested capital.
Frequently asked questions
How much should I risk per trade?
A common guideline is 1–2% of your account balance per trade, so no single loss does serious damage.
What is the most important risk-management tool?
The stop-loss. It caps your loss on every trade and takes emotion out of the exit.
What risk-to-reward ratio should I use?
Aim for at least 1:2. It lets your winners outweigh your losers even with a modest win rate.
Can risk management make me profitable on its own?
It will not create winning trades, but it keeps losses small enough that a decent strategy can succeed over time.
Oil is one of the most actively traded commodities in the world. Its strong trends and sharp reactions to news make it a favourite for active traders. At SCapitalFX you can trade oil as a CFD — going long or short with leverage, no barrels required. Here is how oil trading works, with your real conditions.
What is oil trading?
Oil trading means speculating on the price of crude oil. The two global benchmarks are:
USOIL (WTI): West Texas Intermediate, the US benchmark.
UKOIL (Brent): the international benchmark priced in the North Sea.
As CFDs, you trade the price movement — profiting whether oil rises (go long) or falls (go short) — without owning physical barrels.
Oil and gas specs at SCapitalFX
Symbol
Market
1 lot
Spread from (Raw)
Max leverage
USOIL
WTI crude
1,000 barrels
$0.03
1:50
UKOIL
Brent crude
1,000 barrels
$0.03
1:50
XNGUSD
Natural gas
10,000 units
$0.005
1:50
A $6 round-turn commission applies on a Raw account (zero on Standard).
How profit and loss work
One standard lot of USOIL is 1,000 barrels, so every $1 move in the oil price equals $1,000 of profit or loss per lot. Oil can swing $1–$3 in a single day, so most beginners trade 0.01 lots (10 barrels), where a $1 move is just $10 — keeping risk small.
What moves the price of oil?
Supply and demand — global growth lifts demand; recessions cut it.
OPEC+ decisions — production cuts or increases move prices fast.
US inventory data — the weekly EIA crude stocks report (usually Wednesday) often causes sharp moves.
Geopolitics — conflict in oil regions can spike prices.
The US dollar — oil is priced in dollars, so a stronger dollar can weigh on it.
Open the USOIL chart and study the trend on a higher timeframe.
Decide long or short, then set your stop-loss and take-profit.
Start with 0.01 lots and manage the trade to your plan.
Best times to trade oil
Oil is most active during the US session, and especially around the weekly EIA inventory release and OPEC announcements. See our best time to trade guide.
Risk warning: Oil is highly volatile and trading oil CFDs on margin carries a high level of risk. You could lose some or all of your invested capital. Always use a stop-loss.
Frequently asked questions
What is the difference between WTI and Brent?
WTI (USOIL) is the US benchmark; Brent (UKOIL) is the international one. They usually move together but can trade at slightly different prices.
Can I short oil?
Yes. As a CFD you can go short to profit when oil falls, just as you go long when it rises.
How much money do I need to trade oil?
You can start small with 0.01-lot positions. Because each $1 move is $1,000 on a full lot, keep your size modest and always use a stop-loss.
When does oil move the most?
Around the US session, the weekly EIA inventory report, and OPEC+ decisions.
A price chart is a trader’s main tool — it shows you what the market is doing at a glance. The most popular type is the candlestick chart, and once you can read one, technical analysis starts to make sense. This beginner’s guide explains how to read forex charts, candlesticks, timeframes and the key patterns.
The three main chart types
Line chart: connects closing prices — simple, good for spotting the overall direction.
Bar chart: shows open, high, low and close for each period.
Candlestick chart: the same data as a bar chart but far easier to read — and the trader favourite.
How to read a candlestick
Each candle shows four prices for its time period — the open, high, low and close:
The thick part is the body (from open to close).
The thin lines are the wicks (the high and low).
A bullish candle (often green) closes higher than it opened.
A bearish candle (often red) closes lower than it opened.
Long bodies show strong momentum; long wicks show rejection of a price level.
Timeframes
Each candle represents a chosen period — 1 minute, 1 hour, 4 hours, daily, and so on. The SCapitalFX app offers multiple timeframes. A simple beginner approach:
Use a higher timeframe (daily or 4-hour) to see the overall trend.
Use a lower timeframe (1-hour or 15-minute) to time your entry.
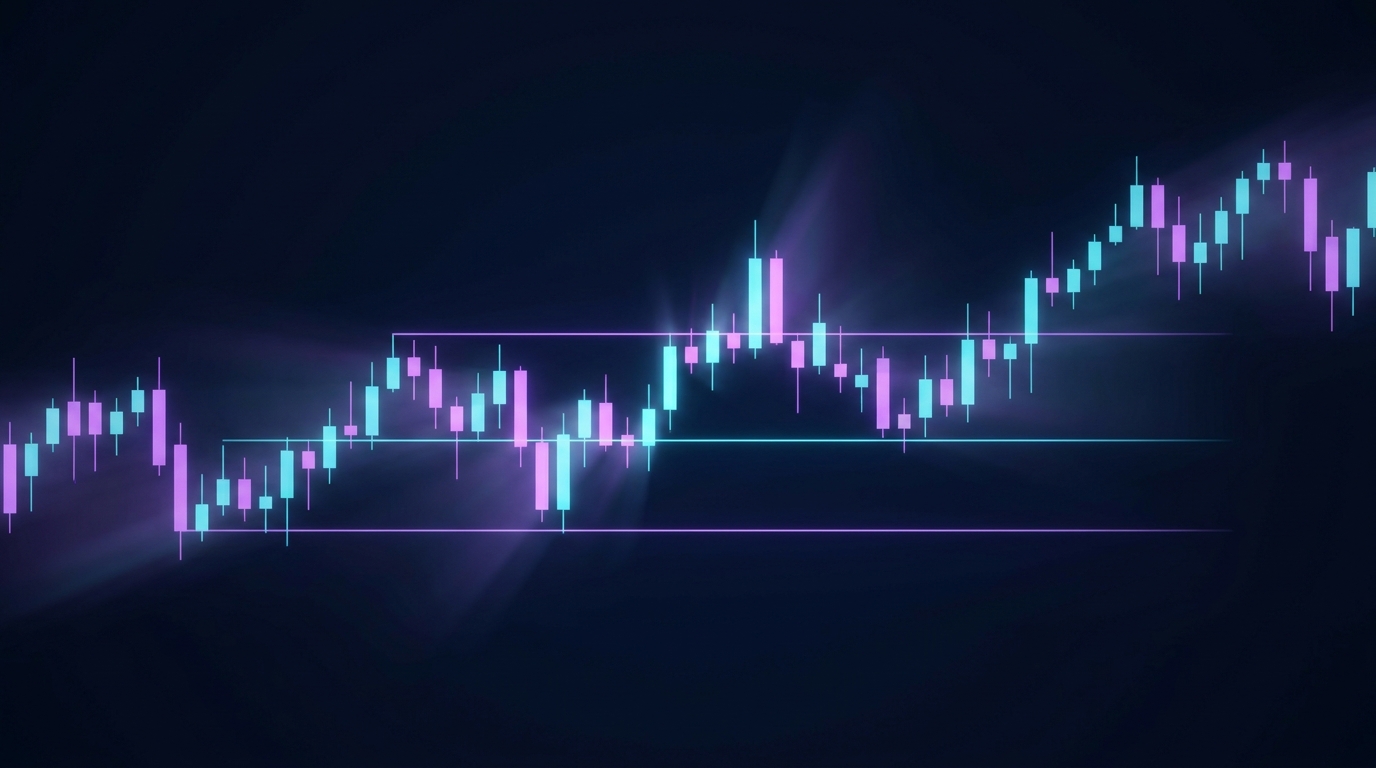
Support and resistance
These are the building blocks of chart reading:
Support: a price level where falling prices tend to bounce up.
Resistance: a level where rising prices tend to stall and fall.
Traders watch for price to bounce off, or break through, these levels.
Spotting the trend
Uptrend: higher highs and higher lows.
Downtrend: lower highs and lower lows.
Range: price moving sideways between support and resistance.
A few candlestick patterns to know
Doji: open and close almost equal — indecision, possible reversal.
Hammer: small body with a long lower wick — potential bottom.
Engulfing: a big candle that fully covers the previous one — a strong momentum shift.
Patterns are clues, not guarantees — always combine them with trend and support/resistance.
Risk warning: No chart pattern predicts the market with certainty. Trading carries a high level of risk and you could lose your invested capital. Always use a stop-loss.
Frequently asked questions
What is the best chart type for beginners?
Candlestick charts — they pack the most information into an easy-to-read format and are the industry standard.
What timeframe should beginners use?
Start on higher timeframes (4-hour or daily). They are less noisy and easier to read than 1-minute charts.
What do the candle colours mean?
Green (or white) usually means the price closed higher than it opened; red (or black) means it closed lower.
Do I need indicators to read charts?
No — price action, trend and support/resistance are enough to start. Indicators can be added later as a complement.
Index trading lets you trade the direction of an entire stock market in a single position — instead of picking individual companies. Indices like the S&P 500, Dow and Nasdaq are popular for their strong trends and built-in diversification. Here is how to trade indices as CFDs, with your real SCapitalFX conditions.
What is a stock index?
An index measures the combined performance of a group of company shares. For example, the US 500 (S&P 500) tracks 500 of the largest US companies, so it reflects the broad US stock market. When you trade an index CFD you are betting on whether that whole basket goes up or down — no need to analyse single stocks.
Why trade indices?
Instant diversification — one trade gives exposure to dozens or hundreds of companies.
Strong, clean trends — indices often trend more smoothly than single stocks.
No single-company risk — one bad earnings report will not sink the whole index.
Go long or short with leverage, from the same account as forex and gold.
Indices you can trade at SCapitalFX
Symbol
Tracks
Spread from (Raw)
Max leverage
US500
S&P 500 (US)
0.5 pts
1:50
US30
Dow Jones (US)
1.8 pts
1:50
USTEC
US tech 100 / Nasdaq
1.5 pts
1:100
UK100
FTSE 100 (UK)
1.2 pts
1:50
DE30
DAX (Germany)
1.2 pts
1:100
JP225
Nikkei 225 (Japan)
7.0 pts
1:100
All carry the same $6 round-turn commission on a Raw account (zero on Standard).
How profit and loss work
One standard lot equals one index contract, so each 1.0-point move is worth about $1 per lot. Indices like the Dow can move hundreds of points in a day, so a 100-point move on 1 lot is around $100. Most beginners trade 0.01 lots, where that same 100-point move is about $1 — keeping risk small.
What moves index prices?
Company earnings from the big constituents
The economy — growth, jobs and inflation data
Interest rates set by central banks
Risk sentiment — optimism lifts indices, fear pulls them down
Open an index chart such as US500 and check the trend on a higher timeframe.
Decide long or short, then set a stop-loss and take-profit.
Start with 0.01 lots and manage the trade to your plan.
Best times to trade indices
Trade each index around its home session: US indices (US500, US30, USTEC) are most active during the New York session and around US data; DE30 and UK100 move most during the London session; JP225 during the Asian session. See our best time to trade guide.
Risk warning: Trading index CFDs on margin carries a high level of risk and may not be suitable for everyone. Indices can move sharply around news. You could lose some or all of your invested capital.
Frequently asked questions
What is the easiest index for beginners?
The US 500 (S&P 500) is popular with beginners thanks to its liquidity, clear trends and tight spreads.
Can I short an index?
Yes. As a CFD you can go short to profit from a falling market, just as you go long in a rising one.
How much money do I need to trade indices?
You can start small with 0.01-lot positions. Because indices move in large point swings, keep your size modest and always use a stop-loss.
Is trading an index the same as trading stocks?
It gives you exposure to the overall stock market in one position, without the risk of any single company. See forex vs stocks.
Cryptocurrencies like Bitcoin and Ethereum are among the most exciting — and most volatile — markets you can trade. At SCapitalFX you trade them as CFDs, which means you can profit from both rising and falling prices, use leverage, and fund with crypto — all from the same account you use for forex and gold. Here is how crypto CFD trading works and how to start.
What is crypto CFD trading?
A crypto CFD (contract for difference) lets you trade the price of a cryptocurrency without owning the coin. You are not buying Bitcoin into a wallet — you are trading on whether its price rises or falls. The advantages:
Go long or short — profit (or lose) whether crypto rises or falls.
No wallet or exchange account to manage, and no private keys to secure.
Leverage up to 1:20, so a smaller deposit controls a larger position.
One account for crypto, forex, gold, indices and energy.
Bitcoin and Ethereum CFDs at SCapitalFX
BTC/USD
ETH/USD
1 lot equals
1 Bitcoin
1 Ethereum
Spread from (Standard)
$25
$2.50
Spread from (Raw)
$15
$1.50
Commission (Raw)
$6 round-turn / lot
$6 round-turn / lot
Max leverage
1:20
1:20
Min trade size
0.01
0.01
How profit and loss work: one lot of BTC/USD equals 1 Bitcoin, so a $100 move in the Bitcoin price is $100 of profit or loss per lot. Most beginners trade micro lots (0.01) — so the same $100 move is just $1 — to keep risk small while crypto swings.
Why crypto gets lower leverage
Crypto is far more volatile than forex, so leverage is capped at 1:20 (versus up to 1:200 on forex majors). That is a safety feature: at 1:20 you post 5% margin, giving your account more room to handle big swings. Learn more in our guide to leverage.
Open the BTC/USD chart (or ETH/USD) and study the trend on a higher timeframe.
Decide long or short based on your analysis.
Set a stop-loss and take-profit before you enter.
Start with a micro lot (0.01) to keep risk small.
Place the trade and manage it — stick to your plan.
What moves crypto prices?
Adoption and demand — institutional buying, ETFs and real-world use.
Regulation and news — government decisions can move prices fast.
Macro conditions — interest rates, the US dollar and overall risk appetite.
The Bitcoin halving cycle — supply issuance drops roughly every four years.
Sentiment and liquidations — fear and greed drive sharp, sudden moves.
The crypto market itself runs around the clock, including weekends (check the app for exact CFD trading hours).
Managing risk with crypto
Trade small — micro lots while you learn.
Always use a stop-loss; crypto can move 5–10% in a single day.
Do not max out leverage just because you can.
Only risk money you can afford to lose.
Risk warning: Cryptocurrencies are highly volatile and trading crypto CFDs on leverage carries a high level of risk. You could lose some or all of your invested capital. Never trade with money you cannot afford to lose.
The forex market runs 24 hours a day, five days a week — but that does not mean every hour is worth trading. Knowing when to trade is just as important as knowing what to trade. This guide breaks down the global sessions, when the market is most active, and the best (and worst) times to place your trades.
Is forex open 24 hours?
Yes. Forex trades continuously from Sunday evening to Friday evening because it follows the business hours of major financial centres around the world. As one region closes, another opens, so the market never sleeps during the week — but it does close on weekends.
The four major forex sessions
Activity is organised into four sessions named after key financial hubs. Times below are approximate in GMT and shift slightly with daylight saving:
Session
Hours (GMT)
Character
Sydney
21:00 – 06:00
Quiet open of the week
Tokyo (Asian)
00:00 – 09:00
Moderate; JPY, AUD, NZD active
London (European)
08:00 – 16:00
High volume — the biggest session
New York (US)
13:00 – 21:00
High volume; USD and news-driven
The best time to trade: session overlaps
The most active — and usually the best — time to trade is when two sessions are open at once, because liquidity and volatility peak:
London–New York overlap (13:00–16:00 GMT) — the prime window. The two largest sessions run together, giving the tightest spreads and the biggest moves of the day.
Tokyo–London overlap (around 08:00 GMT): a smaller pickup as Europe comes online.
If you can only trade for a couple of hours a day, the London–New York overlap is usually where the best opportunities are.
Best times for specific markets
EUR/USD and GBP/USD: most active during London and New York.
USD/JPY, AUD/USD, NZD/USD: liveliest during the Asian session.
Gold (XAU/USD) and US indices: follow the London–New York window and US data — see our gold trading guide.
Best days of the week to trade
Tuesday to Thursday are typically the most active, trend-friendly days.
Monday often starts slow while the market finds direction.
Friday afternoon winds down as liquidity thins before the weekend.
When to avoid trading
Right into major news (rate decisions, NFP, CPI) unless you have a clear plan — spreads widen and prices whipsaw.
Late New York / daily rollover, when liquidity is thin.
Late Friday and weekends, when the market is closing or shut.
A simple rule for beginners
Trade the London–New York overlap, mid-week, with a plan — and sit out the quiet, low-liquidity hours. Good timing beats long hours in front of the screen. New to the basics? Start with our forex for beginners guide.
Risk warning: Trading forex and CFDs on margin carries a high level of risk and may not be suitable for everyone. You could lose some or all of your invested capital.
Frequently asked questions
What is the single best time to trade forex?
The London–New York overlap, roughly 13:00–16:00 GMT, when liquidity and volatility are highest.
Is forex open on weekends?
No. The market closes Friday evening and reopens Sunday evening (GMT). Crypto markets, however, trade through the weekend.
What is the best time to trade gold?
Gold is most active during the London–New York overlap and around major US data releases.
Can I trade forex at night?
Yes — the Asian session runs through the night in Europe/US time and suits pairs like USD/JPY and AUD/USD.
Do the best times change with daylight saving?
Yes. Session times shift by about an hour when clocks change, so adjust the GMT windows accordingly.
Gold has been a store of value for thousands of years, and today it is one of the most popular markets in the world to trade. Known by its ticker XAU/USD, gold offers strong trends, deep liquidity and almost round-the-clock action — which is why traders of every level keep it on their watchlist.
This complete guide explains how to trade gold (XAU/USD) step by step: how it works, what moves the price, how much money you need, the best times to trade, beginner-friendly strategies, and how to control your risk. Every number below uses real SCapitalFX conditions, so you know exactly what to expect.
What is XAU/USD (gold)?
XAU/USD is the symbol for gold priced in US dollars. “XAU” is the international code for one troy ounce of gold, and “USD” is the US dollar — so the price simply tells you how many dollars one ounce of gold costs. If XAU/USD is 3,000, one ounce of gold is worth $3,000.
When you trade gold at SCapitalFX you trade it as a CFD (contract for difference). You do not buy physical bars or coins — you trade the price movement. The big advantages:
You can profit (or lose) whether gold goes up — you “buy” / go long — or down — you “sell” / go short.
You can use leverage to control a larger position with a smaller deposit.
There is nothing to store or insure, and you can enter and exit in seconds.
How gold trading actually works (the numbers most guides skip)
Here is exactly how gold is structured on the platform — the concrete details that decide your profit, loss and cost:
Symbol: XAU/USD
Contract size: 1 standard lot = 100 ounces of gold
Minimum trade size: 0.01 lot (a “micro lot” = 1 ounce)
Maximum leverage:1:100
Spreads from: $0.08 (Raw account) or $0.25 (Standard account)
How profit and loss work: because one standard lot is 100 ounces, every $1 move in the gold price equals $100 of profit or loss on a 1-lot position. A micro lot (0.01) is 1 ounce, so each $1 move is worth just $1 — ideal for beginners who want to keep risk small while they learn.
What a gold trade really costs
Your cost is the spread (and, on a Raw account, a small commission). Here is the round-turn cost of trading one standard lot of gold:
Standard account
Raw account
Spread (from)
$0.25 / oz
$0.08 / oz
Spread cost per lot (100 oz)
~$25
~$8
Commission
None
$6 round-turn / lot
Total cost per lot
~$25
~$14
Max leverage
1:100
1:100
Min trade size
0.01 lot (1 oz)
0.01 lot (1 oz)
So trading a full lot of gold costs roughly $14 on a Raw account ($8 spread + $6 commission) versus about $25 on Standard — one reason active gold traders often choose Raw. See our Standard vs Raw account guide for the full comparison.
What moves the price of gold?
Gold does not pay interest or dividends — its price is driven by supply, demand and sentiment. The main forces are:
The US dollar. Gold is priced in dollars, so it usually moves inversely to the USD. A weaker dollar tends to lift gold; a stronger dollar tends to weigh on it.
Interest rates. When central banks (especially the US Federal Reserve) raise rates, holding non-yielding gold becomes less attractive. Rate cuts often support gold.
Inflation. Gold is widely seen as an inflation hedge, so rising inflation expectations can increase demand.
Safe-haven demand. During wars, crises or market panic, investors move into gold for safety, which can cause sharp rallies.
Central-bank and physical demand. Large buying by central banks, plus jewellery and industrial demand, shape the long-term trend.
You do not need to predict all of this. Most beginners do better watching the US dollar and major US data releases, and trading with the trend.
Practise on a demo. Get comfortable placing, modifying and closing gold trades with virtual money first.
Fund your account. The fastest low-cost method is crypto — you can deposit with USDT, BTC and 50+ coins.
Open the XAU/USD chart. Find gold in your watchlist and study the trend on a higher timeframe (like the 4-hour or daily) before zooming in.
Decide buy or sell. Going long if you expect gold to rise, short if you expect it to fall.
Set your stop-loss and take-profit. Always decide your exit before you enter.
Choose your position size. Start with micro lots (0.01) so each $1 move is only $1.
Place the trade and manage it. Follow your plan — don’t move your stop further away just to avoid a loss.
A simple worked example
Suppose gold is trading at $3,000 and you go long 0.10 lots (10 ounces). You set a stop-loss $10 below and a take-profit $20 above:
If gold rises $20 to $3,020, your profit is 10 oz × $20 = +$200.
If gold falls $10 to $2,990 and hits your stop, your loss is 10 oz × $10 = -$100.
That is a 2:1 reward-to-risk trade — a healthy ratio to aim for as a beginner.
How much money do you need to trade gold?
Less than most people think. Thanks to micro lots and 1:100 leverage, you can start small:
Margin: at 1:100 you only need about 1% of the position’s value as margin. For a 0.10-lot trade (10 oz) with gold near $3,000, the position is worth about $3,000 and needs roughly $30 in margin.
Risk per trade: the bigger limit is your risk, not your margin. Gold can move $20–$50 in a day, so size your trades so a normal move can’t wipe you out.
You can open a Standard account from just $10, but for gold specifically we suggest a little more buffer so your stop-loss has room. New to position sizing? Read how to start trading with $10 and the fundamentals in our forex trading for beginners guide.
The best times to trade gold
Gold trades nearly 24 hours a day, but liquidity and volatility are not equal across the day. The most active window is the London–New York overlap:
Session
Approx. time (GMT)
What to expect
Asian
00:00 – 08:00
Quieter, narrower ranges
London
08:00 – 16:00
Volatility picks up
London–New York overlap
13:00 – 16:00
Most active — biggest moves
New York
13:00 – 21:00
Driven by US data and the dollar
Gold is especially reactive to US news such as Non-Farm Payrolls (NFP), CPI inflation data and Federal Reserve (FOMC) decisions. These can cause sudden, large moves — exciting but risky for beginners.
Gold trading strategies for beginners
Trend following. Gold trends strongly. Identify the direction on a higher timeframe, then enter pullbacks in that direction. “The trend is your friend” applies well to gold.
Breakout trading. Gold often consolidates, then breaks out sharply. Mark key support and resistance levels and trade the break, with a stop on the other side of the level.
Range trading. In quiet periods gold bounces between support and resistance. Buy near support, sell near resistance, and stop out if the range breaks.
News and safe-haven moves. Advanced traders position around risk events. Beginners should usually wait until after the volatility settles rather than guessing the direction.
Pick one strategy, practise it on demo, and master it before adding more.
Risk management for gold
Gold is more volatile than most currency pairs, so risk control is essential:
Risk only 1–2% of your balance per trade. On a $500 account that’s $5–$10 of risk — which means small positions and sensible stops.
Always use a stop-loss. Gold’s fast moves can be brutal without one.
Respect leverage. 1:100 is powerful; using the maximum on every trade is the quickest way to lose an account.
Size from your stop, not your margin. Decide how many dollars you’ll risk, divide by your stop distance, and that gives your position size.
Avoid trading right into major news until you have experience.
Common gold-trading mistakes to avoid
Using too much leverage and oversizing positions
Trading without a stop-loss
Chasing price after a big move instead of waiting for a setup
Ignoring the US dollar and interest-rate backdrop
Revenge trading after a loss
Why trade gold with SCapitalFX?
Tight gold spreads from $0.08 on a Raw account
Leverage up to 1:100 and micro lots from 0.01
Fast crypto funding — start with USDT, BTC and 50+ coins
A free demo so you can practise gold trades risk-free first
Risk warning: Trading gold and other CFDs on margin carries a high level of risk and may not be suitable for every investor. Gold can be highly volatile and you could lose some or all of your invested capital. Never trade with money you cannot afford to lose.
Frequently asked questions
Is gold (XAU/USD) good for beginners?
Yes, with care. Gold trends well and is easy to follow, but it is volatile — so start with micro lots, use a stop-loss, and practise on a demo first.
How much money do I need to start trading gold?
You can open an account from $10, and a 0.10-lot trade needs only around $30 in margin at 1:100. For comfortable risk control on gold, a slightly larger balance gives your stop-loss more room.
What does it cost to trade gold?
From about $14 round-turn per standard lot on a Raw account ($8 spread + $6 commission), or about $25 on a Standard account (spread only, no commission).
What leverage can I use on gold?
Up to 1:100, meaning roughly 1% of the position value is needed as margin. Higher leverage increases both potential profit and potential loss.
When is the best time to trade gold?
The London–New York overlap (about 13:00–16:00 GMT) is the most active. Gold also moves sharply around US data like NFP, CPI and Fed decisions.
Can I trade gold on my phone?
Yes. You can trade XAU/USD from the SCapitalFX mobile app with live charts, multiple timeframes and instant execution.
Can I make money when gold falls?
Yes. Because you trade gold as a CFD, you can go short (sell) to profit from falling prices, just as you go long (buy) to profit from rising prices.
Is XAU/USD the same as spot gold?
Yes — XAU/USD is the spot price of one ounce of gold in US dollars, which is what you trade as a CFD here (no futures expiry to worry about).