A price chart is a trader’s main tool — it shows you what the market is doing at a glance. The most popular type is the candlestick chart, and once you can read one, technical analysis starts to make sense. This beginner’s guide explains how to read forex charts, candlesticks, timeframes and the key patterns.
The three main chart types
- Line chart: connects closing prices — simple, good for spotting the overall direction.
- Bar chart: shows open, high, low and close for each period.
- Candlestick chart: the same data as a bar chart but far easier to read — and the trader favourite.
How to read a candlestick
Each candle shows four prices for its time period — the open, high, low and close:
- The thick part is the body (from open to close).
- The thin lines are the wicks (the high and low).
- A bullish candle (often green) closes higher than it opened.
- A bearish candle (often red) closes lower than it opened.
Long bodies show strong momentum; long wicks show rejection of a price level.
Timeframes
Each candle represents a chosen period — 1 minute, 1 hour, 4 hours, daily, and so on. The SCapitalFX app offers multiple timeframes. A simple beginner approach:
- Use a higher timeframe (daily or 4-hour) to see the overall trend.
- Use a lower timeframe (1-hour or 15-minute) to time your entry.
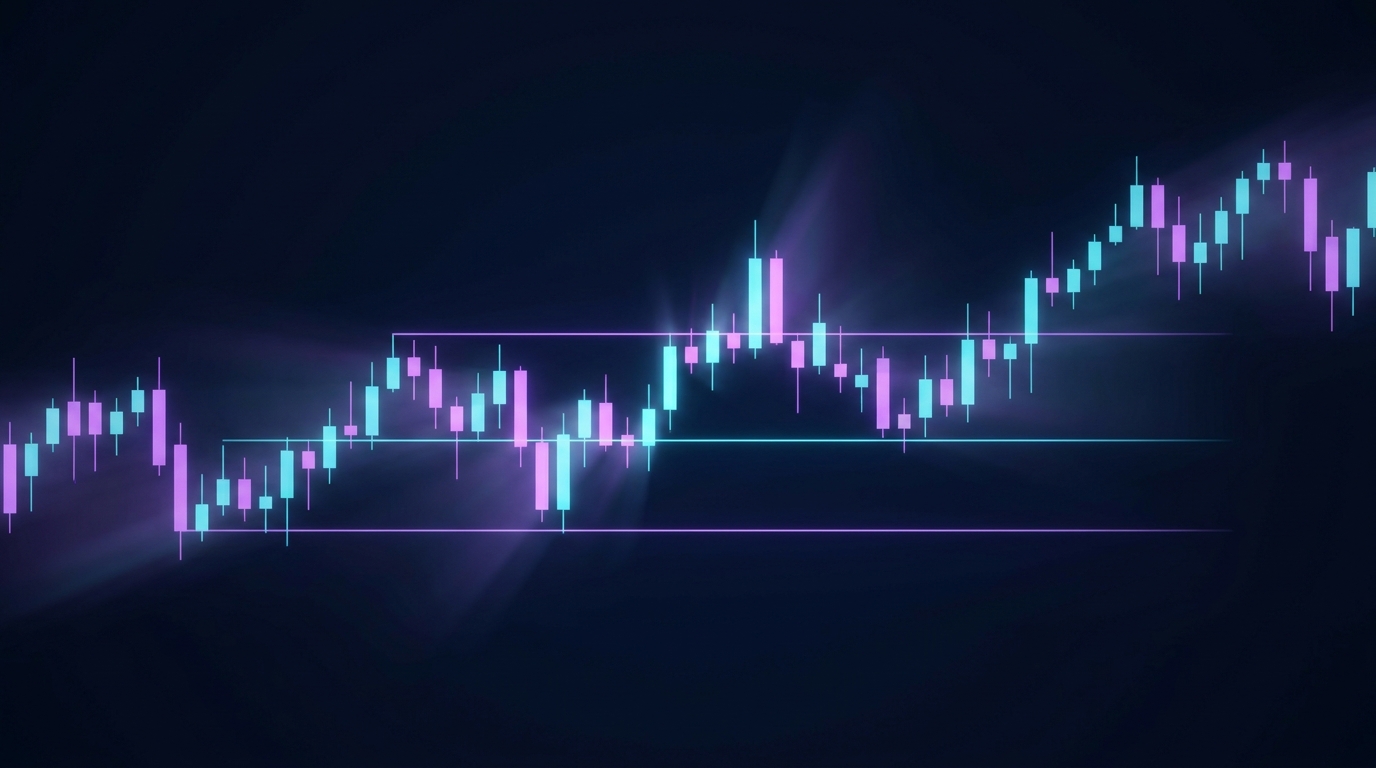
Support and resistance
These are the building blocks of chart reading:
- Support: a price level where falling prices tend to bounce up.
- Resistance: a level where rising prices tend to stall and fall.
Traders watch for price to bounce off, or break through, these levels.
Spotting the trend
- Uptrend: higher highs and higher lows.
- Downtrend: lower highs and lower lows.
- Range: price moving sideways between support and resistance.
A few candlestick patterns to know
- Doji: open and close almost equal — indecision, possible reversal.
- Hammer: small body with a long lower wick — potential bottom.
- Engulfing: a big candle that fully covers the previous one — a strong momentum shift.
Patterns are clues, not guarantees — always combine them with trend and support/resistance.
Risk warning: No chart pattern predicts the market with certainty. Trading carries a high level of risk and you could lose your invested capital. Always use a stop-loss.
Frequently asked questions
What is the best chart type for beginners?
Candlestick charts — they pack the most information into an easy-to-read format and are the industry standard.
What timeframe should beginners use?
Start on higher timeframes (4-hour or daily). They are less noisy and easier to read than 1-minute charts.
What do the candle colours mean?
Green (or white) usually means the price closed higher than it opened; red (or black) means it closed lower.
Do I need indicators to read charts?
No — price action, trend and support/resistance are enough to start. Indicators can be added later as a complement.
Practise on live charts
Open a free demo and study live candlesticks on the SCapitalFX app. New to trading? Read our beginners guide first.